TikTok-Marketing-Campaign-Analysis
TikTok Marketing Campaign Analysis (France · 2024)
Live portfolio: https://dos-analysis.github.io/TikTok-Marketing-Campaign-Analysis/
Repository: https://github.com/Dos-Analysis/TikTok-Marketing-Campaign-Analysis
Table of contents
- Overview
- Objective
- Data & Tools
- Process
- Dashboard
- Answers to the 6 questions
- Recommendations (plain English)
- Simple ROI checks (€)
- Why this project matters
- Links
Overview
I analyzed public TikTok channel data for France (2024) to help a marketing team pick the right creators for paid collaborations.
The results are presented in an interactive Power BI dashboard plus clear recommendations with simple ROI estimates in euros (€).
Objective
Pick creators based on what actually moves the needle:
- Subscribers
- Total views
- Videos published
- Engagement indicators (views per subscriber, engagement per video)
Data & Tools
- Data: Kaggle extract of top French TikTok channels (2024)
- Excel: quick exploration
- SQL Server: cleaning, shaping, validation
- Power BI: interactive visuals + DAX
- GitHub Pages: documentation & hosting
Process
1) Explore the data → keep the columns I need (channel name, subscribers, views, videos).
2) Clean & validate (types, row/column counts, duplicates).
3) Build visuals that answer 6 business questions.
4) Translate metrics into decisions and € ROI scenarios.
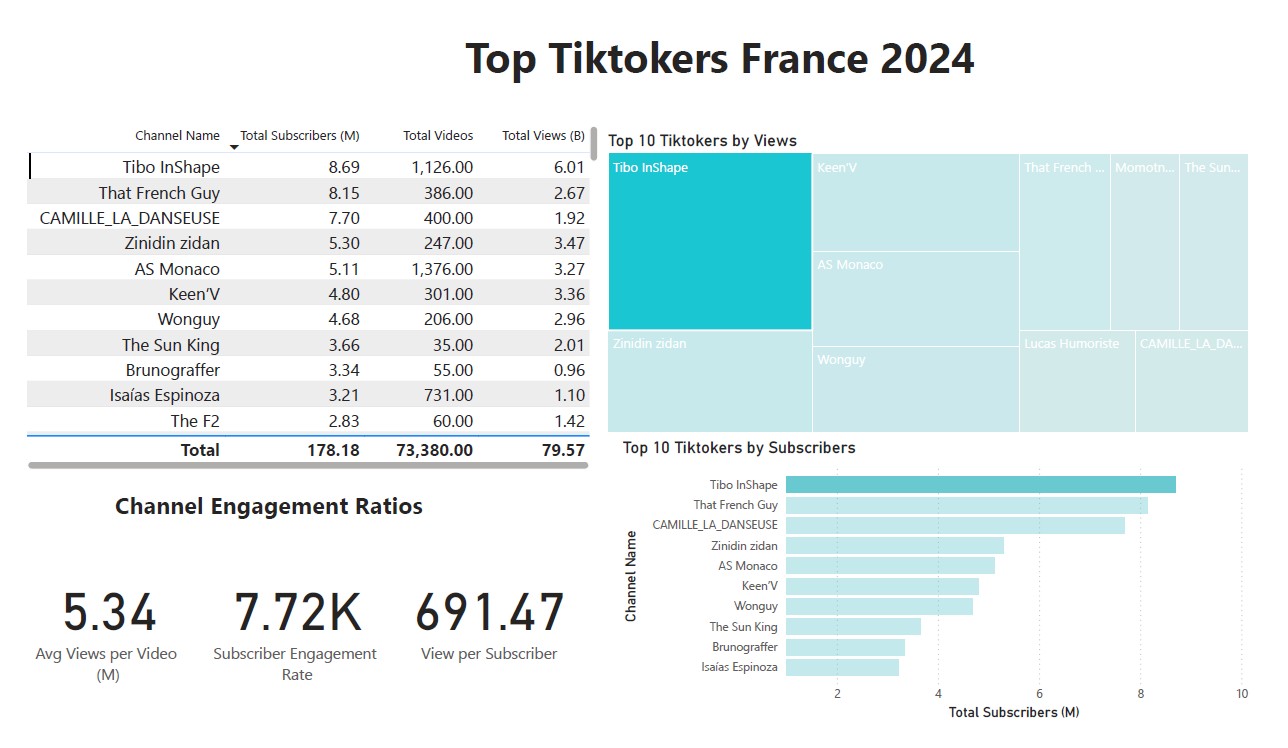
Dashboard
Screenshot (with Tibo Inshape selected — ranked #1 by subscribers in this dataset):
Short GIF showing interactivity:

To understand what dashboard components I require, I chose to address them in the following 6 questions while providing key takeaways after each answer;
1) Who are the top 10 Tiktokers with the most subscribers?
2) Which 3 channels have uploaded the most videos?
3) Which 3 channels have the most views?
4) Which 3 channels have the highest average views per video?
5) Which 3 channels have the highest views per subscriber ratio?
6) Which 3 channels have the highest subscriber engagement rate per video uploaded?
1) Top 10 creators by subscribers
| Name | Subscribers | Avg views/video | |:–|–:|–:| | Tibo InShape | 8 688 608 | 5.34M | | That French Guy | 8 145 455 | 6.92M | | CAMILLE_LA_DANSEUSE | 7 698 611 | 4.80M | | Zinidin zidan | 5 304 348 | 14.06M | | AS Monaco | 5 108 696 | 2.37M | | Keen’V | 4 800 000 | 11.17M | | Wonguy | 4 683 824 | 14.35M | | The Sun King | 3 661 429 | 57.44M | | Brunograffer | 3 335 294 | 17.47M | | Isaías Espinoza | 3 209 434 | 1.50M |
Takeaway: Tibo Inshape leads by subscribers; That French Guy often brings more per-post views, which helps ROI.
2) Top 3 by number of videos
| Name | Videos | Avg views/video | |:–|–:|–:| | Learn French with Pierre! | 24 039 | 20 550 | | H-ley Irène🧿 | 8 628 | 93 085 | | Thomas Rossier | 5 625 | 120 916 |
Takeaway: Volume ≠ impact. Check views per video before funding a series.
3) Top 3 by total views
| Name | Total views | Avg views/video | |:–|–:|–:| | Tibo InShape | 6.01B | 5.34M | | Zinidin zidan | 3.47B | 14.06M | | Keen’V | 3.36B | 11.17M |
Takeaway: Huge total reach → ideal for broad awareness.
4) Top 3 by average views per video
| Name | Avg views/video | Subscribers | |:–|–:|–:| | Oh My Goal – France | 312.89M | 997 444 | | AnnaLaura Pavy | 59.50M | 1 538 710 | | The Sun King | 57.44M | 3 661 429 |
Takeaway: Excellent impact per post.
5) Top 3 by views per subscriber
| Name | Views / subscriber | Subscribers | |:–|–:|–:| | Minajlabomb | 1 185.79 | 1 109 792 | | Elie | 1 061.04 | 1 008 315 | | Céline | 1 031.97 | 1 680 000 |
Takeaway: Content breaks out beyond the base regularly.
6) Top 3 by engagement per video
| Name | Engagement / video | Subscribers | Videos | |:–|–:|–:|–:| | Oh My Goal – France | 332 481 | 997 444 | 3 | | AnnaLaura Pavy | 109 908 | 1 538 710 | 14 | | The Sun King | 104 612 | 3 661 429 | 35 |
Takeaway: Great when you plan fewer, higher-impact placements.
Recommendations
- For maximum per-post impact: start with Zinidin zidan or The Sun King; also consider Oh My Goal – France for premium launches.
- For consistent reach with a large base: Tibo Inshape is a safe pick; That French Guy often delivers better per-post ROI.
- For a 10-video series: Thomas Rossier performs best on expected net return; don’t fund series where average views can’t cover costs.
- Use a pilot → measure → scale approach: test creatives and track sales/engagement before expanding.
Simple ROI checks (€)
Assumptions used for quick comparisons: €5 price, 2% conversion, €50k one-off video fee, or 10×€5k for a series.
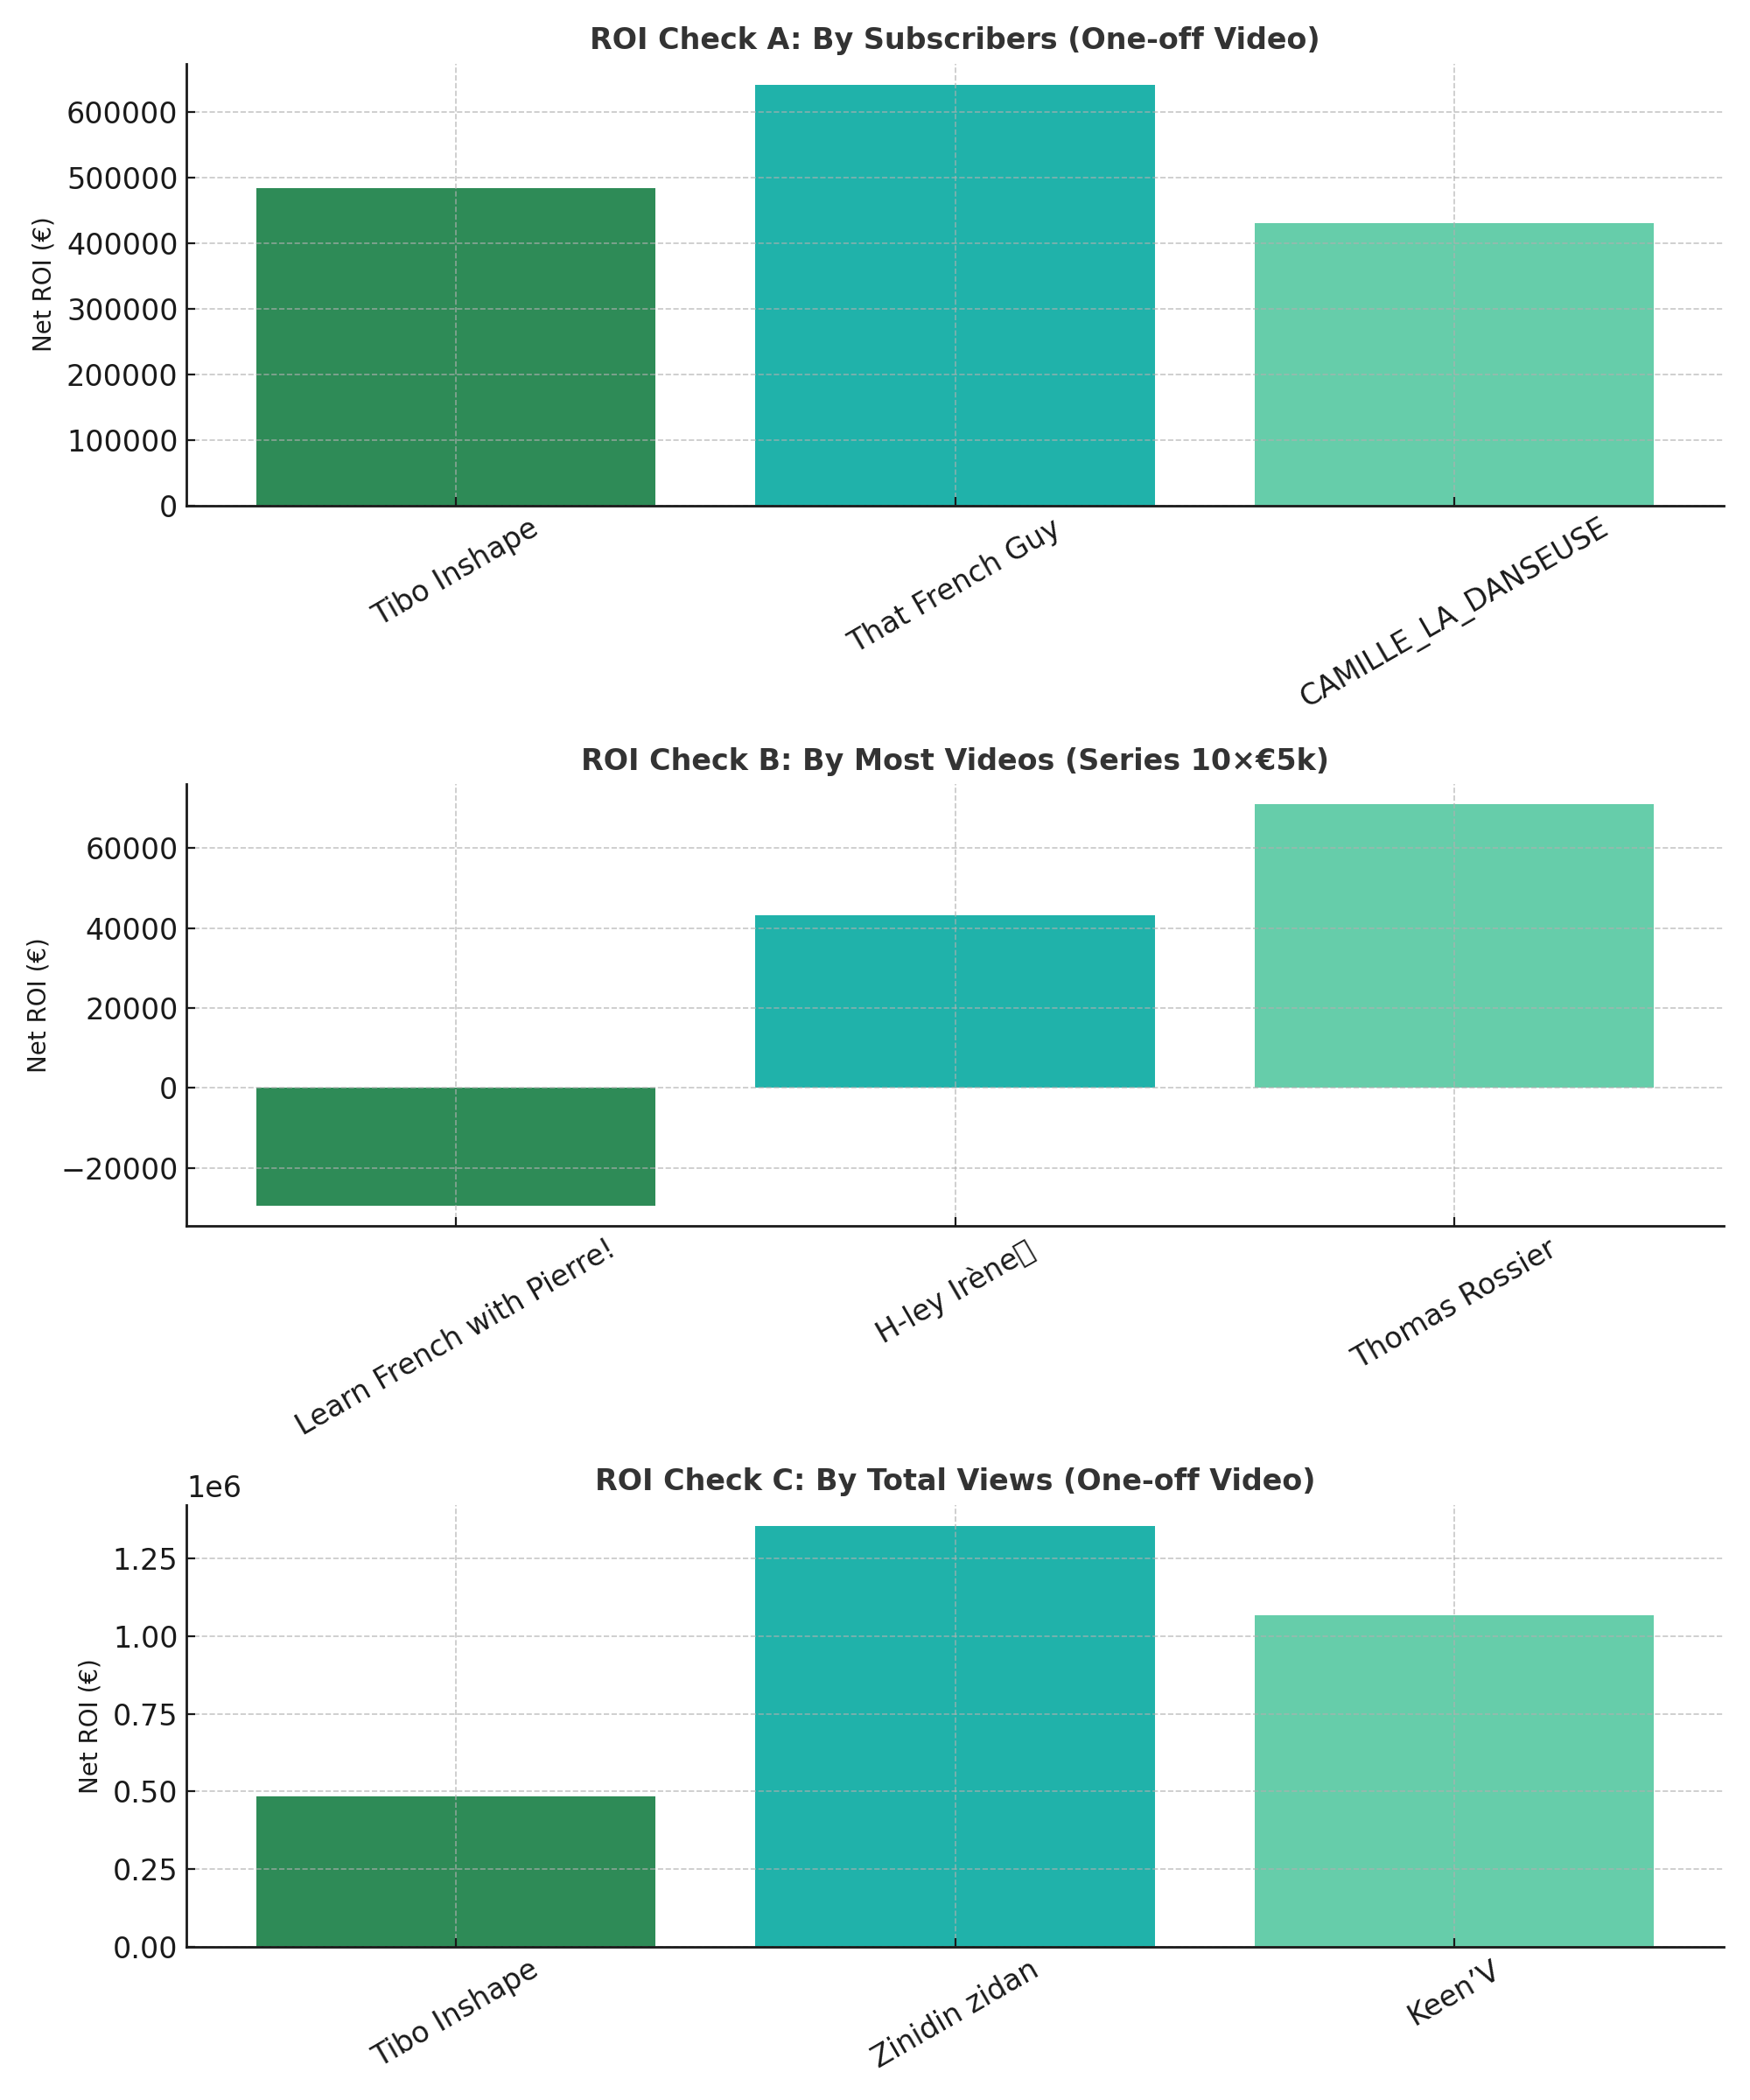
A) Picking by subscribers (one-off video)
| Name | Avg views/video (M) | Units/video | Revenue/video | Net/video | |:–|–:|–:|–:|–:| | Tibo Inshape | 5.34 | 106 712 | €533 559.86 | €483 559.86 | | That French Guy | 6.92 | 138 310 | €691 551.63 | €641 551.63 | | CAMILLE_LA_DANSEUSE | 4.80 | 96 074 | €480 369.76 | €430 369.76 |
Best here: That French Guy.
B) Picking by most videos (series, 10×€5k)
| Name | Avg views/video | Units/video | Revenue/video | Series revenue | Series cost | Net | |:–|–:|–:|–:|–:|–:|–:| | Learn French with Pierre! | 20 550 | 411 | €2 055.03 | €20 550.28 | €50 000 | €-29 449.72 | | H-ley Irène🧿 | 93 085 | 1 862 | €9 308.49 | €93 084.89 | €50 000 | €43 084.89 | | Thomas Rossier | 120 916 | 2 418 | €12 091.58 | €120 915.76 | €50 000 | €70 915.76 |
Best series: Thomas Rossier.
C) Picking by total views (one-off video)
| Name | Avg views/video (M) | Units/video | Revenue/video | Net/video | |:–|–:|–:|–:|–:| | Tibo Inshape | 5.34 | 106 712 | €533 559.86 | €483 559.86 | | Zinidin zidan | 14.06 | 281 176 | €1 405 879.37 | €1 355 879.37 | | Keen’V | 11.17 | 223 362 | €1 116 811.25 | €1 066 811.25 |
Best here: Zinidin zidan.
Note: These are rough, comparable estimates (not forecasts).
Why this project matters
I turned a raw dataset into clear decisions. The dashboard shows who to pick and why.By connecting TikTok metrics with ROI calculations, I show how marketing teams can choose the right influencers with confidence. It highlights my ability to bridge data and business decisions, driving strategies that save costs and maximize impact.
Links
- Live portfolio: https://dos-analysis.github.io/TikTok-Marketing-Campaign-Analysis/
- Repository: https://github.com/Dos-Analysis/TikTok-Marketing-Campaign-Analysis